
Mastering Social Media Key Performance Indicators
Unlock business growth by mastering social media key performance indicators. Learn to choose, track, and optimize the metrics that truly drive results.
Social media key performance indicators (KPIs) are the specific, measurable values that tell you if your social media efforts are actually working. They cut through the noise to answer the most important questions, like “Is my content reaching the right people?” and “Are my campaigns actually driving sales?”
Think of them as the vital signs for your online presence. Without them, you're just guessing.
What Are Social Media KPIs and Why They Matter
Trying to grow on social media without clear KPIs is like sailing a ship without a compass. Sure, you're busy—you’re posting content and chatting with followers—but you have no real way of knowing if you're heading toward your destination or just drifting aimlessly in a vast digital ocean.
This is where social media KPIs come in. They are your essential navigation tools.
These aren't just vanity metrics like your follower count. Instead, they are carefully chosen data points that tie your social media activities directly to real business goals. When you track the right KPIs, you turn your social strategy from a hopeful experiment into a predictable engine for growth.
Beyond Data Points to Strategic Insights
The real power of KPIs isn’t in the numbers themselves, but in the questions they help you answer. Instead of wondering, you can find out for sure:
- Visibility: Is anyone actually seeing our content?
- Engagement: Does our audience even care about what we’re sharing?
- Conversion: Are our social media efforts bringing in leads and making us money?
This infographic breaks down how these core KPI categories work together to measure what truly matters for your brand.
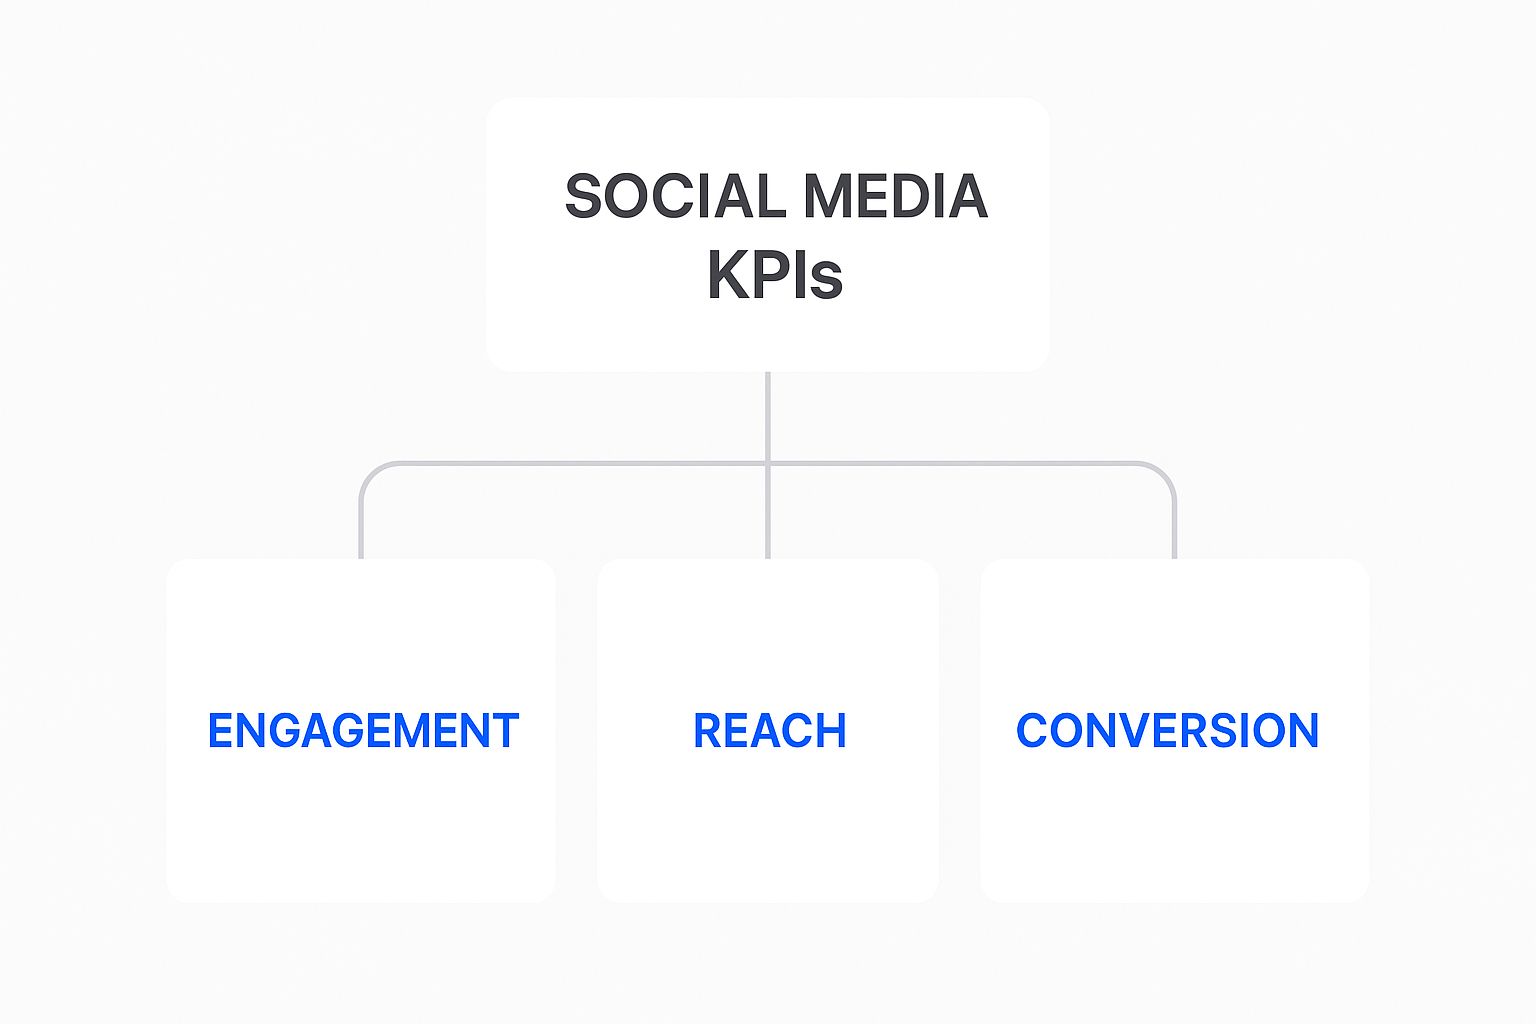
As the visual shows, every meaningful metric flows from your main business goal and fits into one of three core pillars: Reach, Engagement, and Conversion.
{{INTERN}}
The Three Core Categories of Social Media KPIs
To make sense of all the data available, it helps to group your KPIs into three main buckets. This framework keeps your analysis focused on what drives real results.
Here’s a quick breakdown of what each category measures and the fundamental business question it answers.
These three categories form the bedrock of any solid social media measurement strategy. They help you look beyond the surface and understand the complete story of your performance.
By focusing on the right KPIs, you avoid the trap of "vanity metrics"—numbers that look good on paper but don't contribute to the bottom line. A high follower count is nice, but a high conversion rate is what builds a sustainable business.
Understanding these pillars allows you to analyze not just what is happening, but why it's happening. This insight is what empowers you to double down on what works and fix what doesn't. To see how these ideas fit into the bigger picture of digital measurement, it's worth exploring how to measure content performance metrics across all your channels.
How KPIs Turn Strategy Into Predictable Results
Running an Instagram account without clear social media key performance indicators is a bit like driving blindfolded. Sure, you're moving, but you have no idea where you're going or if you're even on the right road. KPIs are the foundation of any real strategy, giving you the clarity and hard evidence needed to make smart decisions.
Instead of just guessing what works, a data-first approach connects every post and story to a real business outcome. This is how you transform your social media from a fun side project into a reliable engine for growth. It’s how the pros justify their marketing budgets, show a clear return on investment (ROI), and confidently tweak their strategies for even better results.
From Ambition to Actionable Steps
Let's be honest: a social media strategy without KPIs is just a wish list. A goal like "we want to increase brand awareness" sounds good, but it’s fuzzy and impossible to measure. The magic happens when you attach specific KPIs to that goal, making it tangible and trackable.
For example, that vague goal transforms into a concrete objective: "Achieve a 20% increase in post reach and a 15% lift in our Social Share of Voice this quarter." Now that's a target.
Suddenly, your team knows exactly what success looks like. They can build a content plan designed to hit those specific numbers. Every single post, Reel, and campaign now has a clear purpose tied to a measurable result. This is how you start getting predictable, repeatable growth.
KPIs are the bridge between your big-picture business goals and the day-to-day tasks your social media team is grinding on. They make sure every piece of content you create and every dollar you spend is pushing the company forward in a way you can actually measure.
This disciplined approach helps you spot hidden opportunities for growth you'd otherwise miss. It lets you pivot quickly when something isn't working and double down on the content that truly connects with your audience.
Using KPIs to Justify Investment and Prove ROI
One of the toughest jobs for any marketer is proving the value of their work to the higher-ups. Stakeholders want to see how Instagram contributes to the bottom line, not just that you're racking up likes and comments. This is where KPIs become your secret weapon.
Think about these two ways to report on a campaign:
- Scenario A (No KPIs): "Our new campaign is doing great! We're getting a lot of positive feedback and our follower count is going up." It sounds nice, but it's not going to convince anyone to increase your budget.
- Scenario B (With KPIs): "Our new campaign drove a 35% increase in website traffic from Instagram, leading to $15,000 in sales we can directly attribute to our efforts. Our Cost Per Conversion was just $5, which is 20% below the industry benchmark." Now that statement proves undeniable value.
The second scenario uses conversion-focused KPIs to paint a clear picture of financial impact. It shows you're not just busy—you're generating revenue efficiently.
Using the right tools can make this picture even sharper. Marketers who use social listening tools often report having double the confidence in measuring ROI. As you can see in these recent social media statistics, deeper data analysis gives you more certainty in your results.
At the end of the day, a solid command of your social media key performance indicators helps you speak the language of business leaders. It empowers you to build a rock-solid case for more resources, experiment with new ideas, and cement social media’s role as a vital part of the company's growth.
Measuring Your Brand's Visibility With Reach KPIs
So, how far is your message actually traveling? While engagement metrics tell you who's connecting with your content, Reach KPIs measure the pure, unadulterated breadth of your brand's visibility.
Think of it as the total size of the audience you have the potential to influence. It's the very first, most critical step in your marketing funnel. After all, if people don't see your content, they can't possibly engage with it, let alone become customers.
These foundational social media key performance indicators tell you exactly how many unique individuals laid eyes on your content. Getting a handle on this is the key to figuring out whether low engagement is a content problem or just a visibility problem.
Reach vs. Impressions: The Billboard Analogy
One of the most common trip-ups in social media analytics is the difference between Reach and Impressions. Let's clear this up once and for all with a simple analogy.
Imagine you've put up a billboard on a busy highway.
- Reach is the number of unique cars that drive past your billboard in a day. If 1,000 different cars pass by, your reach is 1,000.
- Impressions are the total number of times your billboard is seen. If some of those 1,000 cars drive past three times during their daily commute, your impressions might be 3,000.
Impressions will almost always be a bigger number than reach. Both are useful! Reach tells you how wide your net is, while a high impression-to-reach ratio shows your content is being shown multiple times to the same people—great for reinforcing a message.
Core Reach KPIs To Track
Beyond the basics, a few other visibility metrics can paint a much richer picture of your brand's momentum and place in the market.
- Audience Growth Rate: This is all about how quickly you're gaining (or losing) followers. It’s a vital sign of your brand's momentum. A follower count that's flatlining means your reach is probably doing the same. To calculate it, just divide your new followers by your total followers over a set period and multiply by 100.
- Web Traffic Referrals: This KPI is gold. It tracks how many people land on your website by clicking a link from your social media. It's a direct measure of how well your social presence is funneling traffic to places you own, like your blog or product pages.
- Social Share of Voice (SOV): This is a more advanced metric that stacks your brand's visibility up against your competitors. It figures out what percentage of the entire conversation around your industry or specific keywords is about your brand versus everyone else. A higher SOV means you're dominating the discussion.
Key Insight: Don't just track your numbers in a vacuum. A "good" reach completely depends on your industry and your specific goals. The real power is in watching these KPIs over time to spot trends. A sudden, sharp drop in reach, for example, could be an early warning that something's wrong.
Sometimes, a dip in visibility has nothing to do with your content strategy. It's important to understand potential roadblocks, like learning What Is Shadow Banning On Social Media. Knowing about these issues is crucial for troubleshooting and making sense of your data.
How To Expand Your Reach
Tracking numbers is only half the job. The real magic happens when you use that data to actually grow your influence.
- Use Smart Automation with BoostFluence: Manual engagement has limits. BoostFluence automates strategic actions like targeted likes, story views, and profile visits—putting your content in front of the right people at scale. It helps you attract real followers and grow your reach consistently, without spending hours networking or guessing what works.
- Optimize Your Posting Times: Dive into your platform’s analytics. Find out when your audience is most active and schedule your content to drop right in that sweet spot.
- Use Hashtags Strategically: On platforms like Instagram and LinkedIn, the right hashtags act like a search engine, exposing your content to people who don't follow you yet but are hunting for your topics.
- Encourage People to Share: Create stuff that people want to share—think eye-opening infographics, powerful quotes, or genuinely helpful guides. Every time a user shares your post, you get a free pass into their network, boosting your reach organically.
- Collaborate with Others: Team up with other creators or brands in your niche. A simple collaboration or shout-out is one of the quickest ways to get your brand in front of a brand new, highly relevant audience.
By focusing on these practical steps, you can turn your insights into a real strategy for growth. For an even deeper look at this topic, check out our comprehensive guide on other crucial social media metrics to track.
Decoding Engagement KPIs to Build a Loyal Community
If Reach KPIs tell you how many people see your content, then Engagement KPIs tell you how many people actually care. Engagement is the active, beating pulse of your Instagram community. It's what separates someone passively scrolling past your post from someone stopping to think, react, and truly connect with what you're saying.
Think of it this way: Reach is how many invitations you send out for a party. Engagement is how many people actually show up, hit the dance floor, and start meaningful conversations. A healthy engagement rate is a powerful sign that your content is hitting the mark and turning casual viewers into genuine fans. For anyone serious about Instagram growth, this is a critical set of social media key performance indicators to get right.
These metrics go way beyond simply chasing vanity numbers. They measure true audience investment through actions like comments, shares, and saves. A high like count is nice, sure, but a comment that kicks off a conversation or a share that introduces your brand to a whole new network? That’s infinitely more valuable for building real brand loyalty.
What Your Engagement Metrics Really Mean
To get a real feel for your audience, you need to look at what each type of engagement actually means. Not all interactions are created equal; each one tells a slightly different story about how your content is landing. Properly learning how to measure social media engagement is the first step toward building a smarter, data-informed strategy.
Let's break down what these core engagement actions are really signaling to your brand.
Understanding these subtleties helps you analyze your performance on a much deeper level. A post with tons of saves is probably a great educational resource, while one with a flood of comments has successfully sparked a real community discussion.
Advanced Engagement KPIs for Deeper Insights
While likes and comments are your bread and butter, a few advanced KPIs offer a more sophisticated look at your community's health and your content's true impact.
- Engagement Rate: This is the classic formula, measuring the percentage of your audience that engaged with a specific post. You can calculate it by post (Total Engagements ÷ Reach x 100) or by followers (Total Engagements ÷ Followers x 100). It's your go-to metric for gauging how successful any single post was.
- Amplification Rate: This metric focuses on how much your followers are spreading your message for you. You find it by dividing the number of shares by your total number of followers. A high amplification rate means your content is super shareable and is being spread organically.
- Conversation Rate: This one is all about dialogue. Calculated by dividing the number of comments by your total followers, it shows how good you are at actually starting conversations with your community.
Your goal isn't just to be seen; it's to be remembered and talked about. Focusing on Amplification and Conversation rates helps shift your strategy from just broadcasting messages to actually building a community.
With feeds becoming saturated and algorithms favoring genuine interactions, authentic engagement has never been more crucial. People are tired of noise; they want real conversations and connections. This shift makes these advanced engagement metrics absolutely essential for any modern marketer.
{{INTERN}}
Tracking Conversion KPIs That Prove Your ROI
So, Reach tells you who’s seeing your content, and Engagement shows you who cares. But Conversion? This is where the magic really happens. These are the social media key performance indicators that draw a straight line from your Instagram hustle to your business's bottom line.
This is the proof that all your hard work isn't just creating buzz—it's actually generating revenue. These are the numbers that matter most to the people signing the checks. They translate your social media efforts into the language of business, proving the real-world value and return on investment (ROI) of your strategy.
Click-Through Rate (CTR) Your Digital Handshake
Before you can land a sale or capture a lead, you have to get someone to take that first step. That’s where the Click-Through Rate (CTR) comes in. It measures just how compelling your call-to-action (CTA) is by calculating the percentage of people who saw your post and were intrigued enough to click the link.
Think of your CTR as a digital handshake. A high CTR is a great sign; it means your image, your copy, and your CTA are all working together to create an offer your audience can't refuse. A low CTR, on the other hand, tells you something is off. Maybe your offer isn't clear, your link is buried, or your creative simply isn't hitting the mark.
You can find this data in your Instagram Insights or get even more granular by using UTM parameters. These are little snippets of code you add to your URLs that let you track exactly where your website traffic is coming from inside tools like Google Analytics.
Conversion Rate The Ultimate Measure of Success
Getting the click is a great start, but it's only half the battle. The Conversion Rate is the KPI that reveals what happens after the click. It measures the percentage of visitors who followed through and completed a specific goal, whether that's making a purchase, signing up for a newsletter, or downloading a free guide.
This metric is arguably the most critical of all social media key performance indicators for proving ROI. It directly answers the million-dollar question: "Is our Instagram strategy actually turning followers into customers?"
A high Conversion Rate proves you're not just attracting a random audience, but the right audience. It validates your entire sales funnel, from the initial post to the final checkout page.
To track this accurately, you’ll need to set up conversion goals in your analytics software. This usually involves placing tracking codes, like the Meta Pixel, on your website. These snippets of code follow the user's journey and report back, giving you a crystal-clear picture of how many sales or leads your Instagram account is driving.
Cost Per Conversion Optimizing Your Spend
Knowing you’re getting conversions is powerful. But knowing exactly how much each of those conversions is costing you? That’s next-level. The Cost Per Conversion (often called Cost Per Acquisition or CPA) is all about measuring the financial efficiency of your campaigns.
The formula is refreshingly simple:
Total Ad Spend ÷ Total Number of Conversions = Cost Per Conversion
For instance, if you spent $200 on an Instagram ad campaign that brought in 20 new email subscribers, your Cost Per Conversion is $10. This KPI is indispensable for budgeting and knowing when to scale. By keeping a close eye on your CPA, you can make smart decisions about where to put your marketing dollars to get the best possible return.
Tracking these conversion KPIs gives you a rock-solid framework for proving your worth. It elevates your social media reports from "we got a lot of likes" to "we generated $10,000 in revenue." When you’re ready to really double down on this, check out our guide on how to generate leads on social media and start building a powerful, predictable customer pipeline.
Building Your KPI Tracking and Reporting System

So you've got a list of powerful social media key performance indicators. That's a great start, but right now, it's just raw data. Think of it like a pile of fresh ingredients on a kitchen counter—it's not a meal until you have a recipe and a plan.
That's what a tracking system is: your recipe for turning numbers into real, actionable insights that actually drive growth.
This isn't about getting lost in complicated spreadsheets. It’s about being deliberate. You need to pick the right metrics that tie directly back to what you're trying to achieve as a business, then set up a simple way to watch them. This is how you go from just collecting data to being a true strategist.
Aligning KPIs With Business Goals Using SMART
For your tracking efforts to mean anything, your social media KPIs have to connect to your company's bigger picture. One of the most effective ways to do this is with the SMART framework.
This isn't just a corporate buzzword; it's a filter that savvy marketers use to make sure their goals are Specific, Measurable, Attainable, Relevant, and Time-bound. It forces you to focus on meaningful insights instead of getting distracted by vanity metrics.
Let's say your big business goal is to "increase customer loyalty." Chasing a higher follower count won't get you there. Instead, a SMART goal would look something like this:
- Specific: We want to see more signs of customer retention on our Instagram profile.
- Measurable: We'll aim for a 15% increase in our Conversation Rate (comments per follower) and a 10% lift in saved posts.
- Attainable: Looking at our past performance, these targets are a stretch but definitely possible with the right content strategy.
- Relevant: High engagement and content saves are solid proof that our audience is invested in our brand, which points directly to loyalty.
- Time-bound: We'll hit these targets by the end of Q3.
See the difference? A vague idea just became a clear, measurable mission.
Choosing Your Tracking And Reporting Tools
Once you know what you're tracking, you need to figure out how. You've got a few solid options, each with its own pros and cons.
- Native Analytics: Platforms like Instagram Insights and Facebook Business Suite are your starting point. They're free, built-in, and give you a ton of foundational data like reach, engagement, and who your audience is.
- Third-Party Dashboards: Tools such as Sprout Social, Hootsuite, or Agorapulse pull all your data from different platforms into one place. They offer much deeper analytics, let you spy on competitors, and have reporting features that can save you hours of work.
If you're looking for a dedicated platform to help manage your entire content workflow, from strategy to performance tracking, an all-in-one tool can be a game-changer. A great place to start your search is with solutions like Makerbox: Your All-in-One Content Toolbox.
A great report doesn't just spit out numbers; it tells a story. You should show progress over time, celebrate the big wins, and give clear takeaways. Your job is to translate the data and explain what it means for the business and what we should do next.
Ultimately, your tracking system should bring clarity, not create more noise. When you connect your KPIs to real business objectives and use the right tools for the job, you create a powerful feedback loop. This loop not only drives constant improvement but also proves the undeniable value your social media work brings to the table.
Got Questions About Social Media KPIs? We've Got Answers.
Jumping into the world of social media analytics can feel a bit like learning a new language. You hear terms like "KPIs" and "metrics" thrown around, and it's easy to get them mixed up. Let's clear up some of the most common questions so you can start measuring what truly matters with confidence.
What’s the Real Difference Between a Metric and a KPI?
Imagine you're driving your car. The dashboard is lit up with all sorts of numbers: your speed, the engine temperature, how much fuel you have left. All of those are metrics. They're just data points.
But let's say your goal is to make it to the next gas station before the tank runs dry. Suddenly, one of those numbers becomes way more important than the others: the fuel gauge. In that specific situation, your fuel gauge is your Key Performance Indicator (KPI).
It’s the one critical number that tells you if you're on track to hit your most important goal. So, while all KPIs are metrics, only the metrics that are absolutely essential to your business goals get to be called KPIs.
How Often Should I Actually Check My KPIs?
There’s no magic number here—the right reporting schedule really depends on the specific KPI and what you're trying to accomplish. You wouldn't check your quarterly profits every single day, right? The same logic applies here.
Here’s a simple way to think about it:
- Daily or Weekly Peeks: This is for the fast-moving stuff. Think ad campaign performance (like your Cost Per Click or CTR) or keeping an eye out for a potential brand crisis (by monitoring mentions and sentiment). These are the metrics you need to react to quickly.
- Monthly Check-ins: This is your sweet spot for the core strategic goals. Things like audience growth rate, engagement rate, and how much traffic social media is sending to your website. A monthly review gives you enough data to spot real trends without getting distracted by tiny, meaningless daily blips.
- Quarterly Deep Dives: Save this for the big-picture, bottom-line numbers like your overall social media ROI or Customer Lifetime Value. These KPIs take time to develop and are perfect for high-level planning and proving long-term value.
{{INTERN}}
How Do I Explain Social Media ROI to My Boss Without Their Eyes Glazing Over?
When you’re talking to leadership, you need to speak their language, and that language is almost always money. Forget the social media jargon like "amplification rate." They don't care about that. They care about how your work impacts the company's bottom line.
Your job is to translate your social media efforts into cold, hard business results.
Instead of saying, "Our engagement rate hit 3% this month," try this: "Our content on Instagram drove $15,000 in sales last month, and it only cost us $12 to acquire each new customer."
See the difference?
Use simple charts to show growth over time. Draw a straight line from your social media activities to tangible outcomes like leads generated, sales closed, and money saved. Frame every single KPI in terms of how it helps the business grow. That’s how you get buy-in and prove your worth.
Ready to stop guessing and start growing? BoostFluence gives you the tools and expertise to track the KPIs that actually matter and scale your Instagram presence with a data-backed strategy. Discover how BoostFluence can help you succeed.
Want to Grow Your Instagram?
Use BoostFluence tools to grow your followers, engagement, and authority — for ambitious agencies, businesses and creators.


Get More Instagram Followers
Reach your target audience and grow your followers with interactive campaigns.

Swipe Up to Get More Followers!
Get More Instagram Followers
Reach your target audience and grow your followers with interactive campaigns.