
Master Instagram Performance Metrics for Growth
Discover essential Instagram performance metrics to analyze and optimize your strategy for real growth and success. Learn more now!

Instagram metrics are the hard numbers—like reach, engagement, and follower growth—that show you exactly how your content is performing and who it’s connecting with. Don't think of them as just data points on a spreadsheet. Think of them as your strategic compass, guiding your brand's growth and proving your marketing efforts are actually paying off.
Why Your Instagram Metrics Are a Growth Compass
Stop guessing and start navigating. It’s tempting for brands to chase vanity metrics like follower counts, but real, sustainable success comes from understanding the numbers that signal a healthy, growing account that fuels actual business goals.
Imagine you're the captain of a ship. You wouldn't sail into a thick fog without your navigation tools, right? Your Instagram metrics are those sophisticated instruments, helping you chart a clear course to your destination instead of drifting aimlessly.
This is non-negotiable on a platform with such a massive, active user base. The potential to connect is huge, but so is the competition. As of early 2025, Instagram ads alone reached 31.3% of the world's internet users, a staggering figure that underscores its power in marketing. To cut through that noise and grab attention, you have to master the data your account is giving you.
Before we dive into the specific metrics, let's get a high-level view of how they're grouped. This will help you see the bigger picture of what you're measuring.
Core Instagram Metric Categories at a Glance
This table gives you a roadmap for the detailed breakdown to come. Each category tells a different part of your brand's story on Instagram.
Moving Beyond Surface-Level Numbers
When you truly get a handle on these metrics, you unlock the ability to grow your account sustainably and see a real return on your investment. Every single post, Story, and Reel you share generates valuable data. This information tells a story about what your audience loves, what drives them to take action, and frankly, what falls completely flat.
The core idea is simple: analyzing performance is the key to unlocking sustainable growth, boosting genuine engagement, and achieving a measurable return on your marketing investment.
By digging into your analytics, you shift your entire strategy from being reactive to proactive. You’ll stop asking, "What should I post today?" and start knowing, "This is exactly what I need to post to hit my goals."
Here’s what that looks like in practice:
- Audience Growth: You’ll finally understand if your content is attracting the right kind of followers—the ones who are likely to become customers.
- Content Resonance: You can pinpoint which posts, formats, and topics truly connect with your audience, so you can create more of what works.
- Business Impact: You can draw a direct line from your Instagram activity to key business outcomes like website traffic, new leads, and even sales.
To really get a grip on your performance and drive growth, you need to track the most relevant data points. Looking at the top influencer marketing KPIs can give you a solid framework for what to measure. Each metric is a piece of the puzzle, and learning how to read them is your first step. For a deeper dive into the native tools available, check out our complete guide explaining Instagram Insights and what they mean.
{{INTERN}}
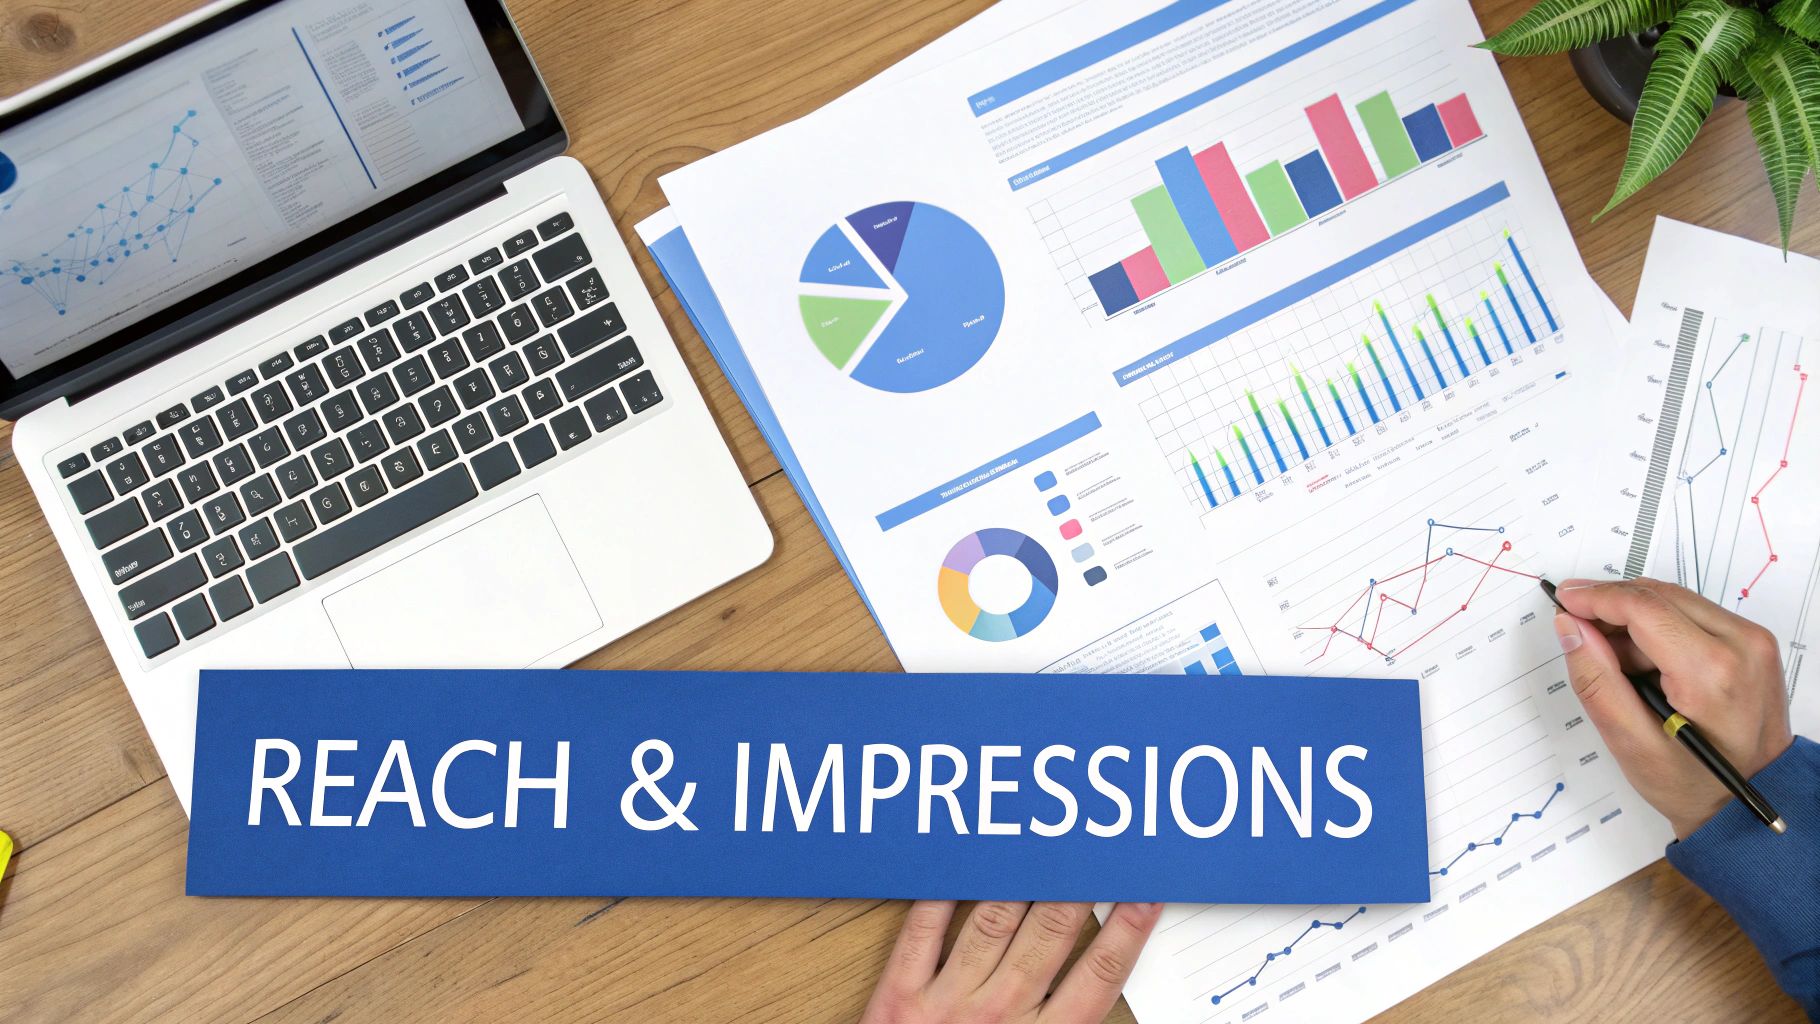
Decoding Reach And Impressions To Measure Awareness
How far is your message really traveling? To figure that out, we need to get to grips with two of the most fundamental Instagram performance metrics out there: Reach and Impressions. They’re the foundation of any brand awareness strategy, yet they're surprisingly easy to mix up.
Think of your Instagram content like a digital billboard on a busy highway. It helps make the difference crystal clear.
- Impressions are the total number of times passing cars see your billboard. If one car drives by five times, that’s five impressions. Simple.
- Reach is the number of unique cars that drove past. That same car that passed five times? It only counts as one for your reach.
Getting this distinction down is the first real step to measuring your visibility. High impressions with low reach might mean a small but dedicated audience sees your stuff over and over. On the other hand, high reach shows your content is successfully breaking out to new people.
Finding Reach And Impressions In Instagram Insights
Thankfully, Instagram doesn't hide this data. You just need to know where to look. You can pull these metrics from your Professional Dashboard for individual Posts, Stories, and Reels.
Here’s how to check the data for a specific piece of content:
- Head over to the post, Story, or Reel you want to dig into.
- Tap on View Insights right below the content.
- You'll get a clean breakdown of Accounts Reached (your Reach) and Impressions.
This quick check gives you instant feedback on how many unique accounts your content touched and the total number of times it was seen.
This concept map shows how these awareness metrics are all connected, feeding into engagement and follower growth to create a cycle of success.

As the visual lays out, growing your reach is the first domino to fall. It kicks off a chain reaction that drives more engagement, which in turn fuels your follower growth.
The “So What” Behind The Numbers
Tracking numbers is one thing, but knowing what they mean for your strategy is a whole different ball game. A high impression-to-reach ratio isn't necessarily a red flag—it often means your content is so good that your audience is coming back for more. They might be re-watching a Reel or revisiting a saved post.
For a deeper dive into these patterns, check out our complete guide on Instagram impressions vs reach.
The goal isn't just to be seen, but to be seen by the right people. Analyzing your reach helps you figure out if you're actually connecting with your target audience or just shouting into the void.
This is huge, especially when you consider Instagram's massive and diverse user base. The platform is a global powerhouse, with huge markets in countries like India (392.5 million users) and the United States (172.6 million users). The biggest age group is 18-24, and the gender split is almost perfectly even, with females making up 51% of users. Your reach metric tells you if you're tapping into these powerful demographics or missing the mark.
Actionable Strategies To Expand Your Reach
Just posting and praying won't get you very far. If you want to grow your reach beyond your current followers, you need to be proactive.
- Master Your Hashtag Game: Don't just slap on random tags. Use a smart mix of broad, niche, and branded hashtags. Think of them as signposts that tell the algorithm exactly who to show your content to.
- Create "Shareable" Content: Design posts that people have to send to their friends or share on their own Stories. We're talking memes, relatable quotes, mind-blowing stats, or super-helpful tips.
- Collaborate With Other Accounts: Team up with influencers or other brands in your space for a shoutout swap or a collaborative post. This is one of the fastest shortcuts to getting your profile in front of a new, highly relevant audience.
- Leverage Reels and Trending Audio: Reels are practically built for discovery. Hopping on a trending sound can massively boost your chances of landing on the Reels tab for people who don't follow you yet.
By consistently keeping an eye on your reach trends, you'll know if these strategies are paying off. If your reach is flatlining or dropping, it’s a clear sign that your content strategy needs a shake-up. Use these Instagram performance metrics not as a report card, but as a roadmap to guide your next move.
Measuring True Connection with Engagement Metrics
If reach and impressions tell you how far your voice travels, engagement metrics tell you how many people actually stopped to listen. Engagement is the pulse of a healthy Instagram account. It’s the proof that your audience is genuinely connecting with your content, not just mindlessly scrolling past it.
Think of it this way: every engagement is an action, and each action signals a different level of commitment from your audience. They all tell a unique story about how your content landed.
The Four Pillars of Instagram Engagement
It's a mistake to treat all interactions as equal. Getting a handle on the difference between a simple Like and a more deliberate action like a Save is key to understanding your instagram performance metrics and what they're really telling you.
- Likes: This is the most basic form of engagement, the digital equivalent of a quick nod. It’s a low-effort signal that says, "I see this, and I approve." While good, it's really just a surface-level indicator.
- Comments: A comment requires actual thought. It cracks open a conversation between you and your audience, signaling that your content was compelling enough to make someone stop and type out a response.
- Shares: When someone shares your post to their Story or DMs it to a friend, that’s a powerful endorsement. They're essentially putting their own reputation on the line to vouch for your content.
- Saves: This is arguably the most valuable engagement of all. A Save is the ultimate compliment. It means your content was so useful or inspiring that someone decided to bookmark it for later.
A "Like" is a quiet acknowledgment, but a "Save" is a loud declaration that your content has long-term value. Focusing on creating 'save-worthy' material is a surefire way to build an asset library your audience treasures.
This hierarchy is crucial. A post with tons of likes is nice, but one with a high number of saves and shares signals a much deeper connection. That's the kind of high-value content the Instagram algorithm loves to reward with more visibility.
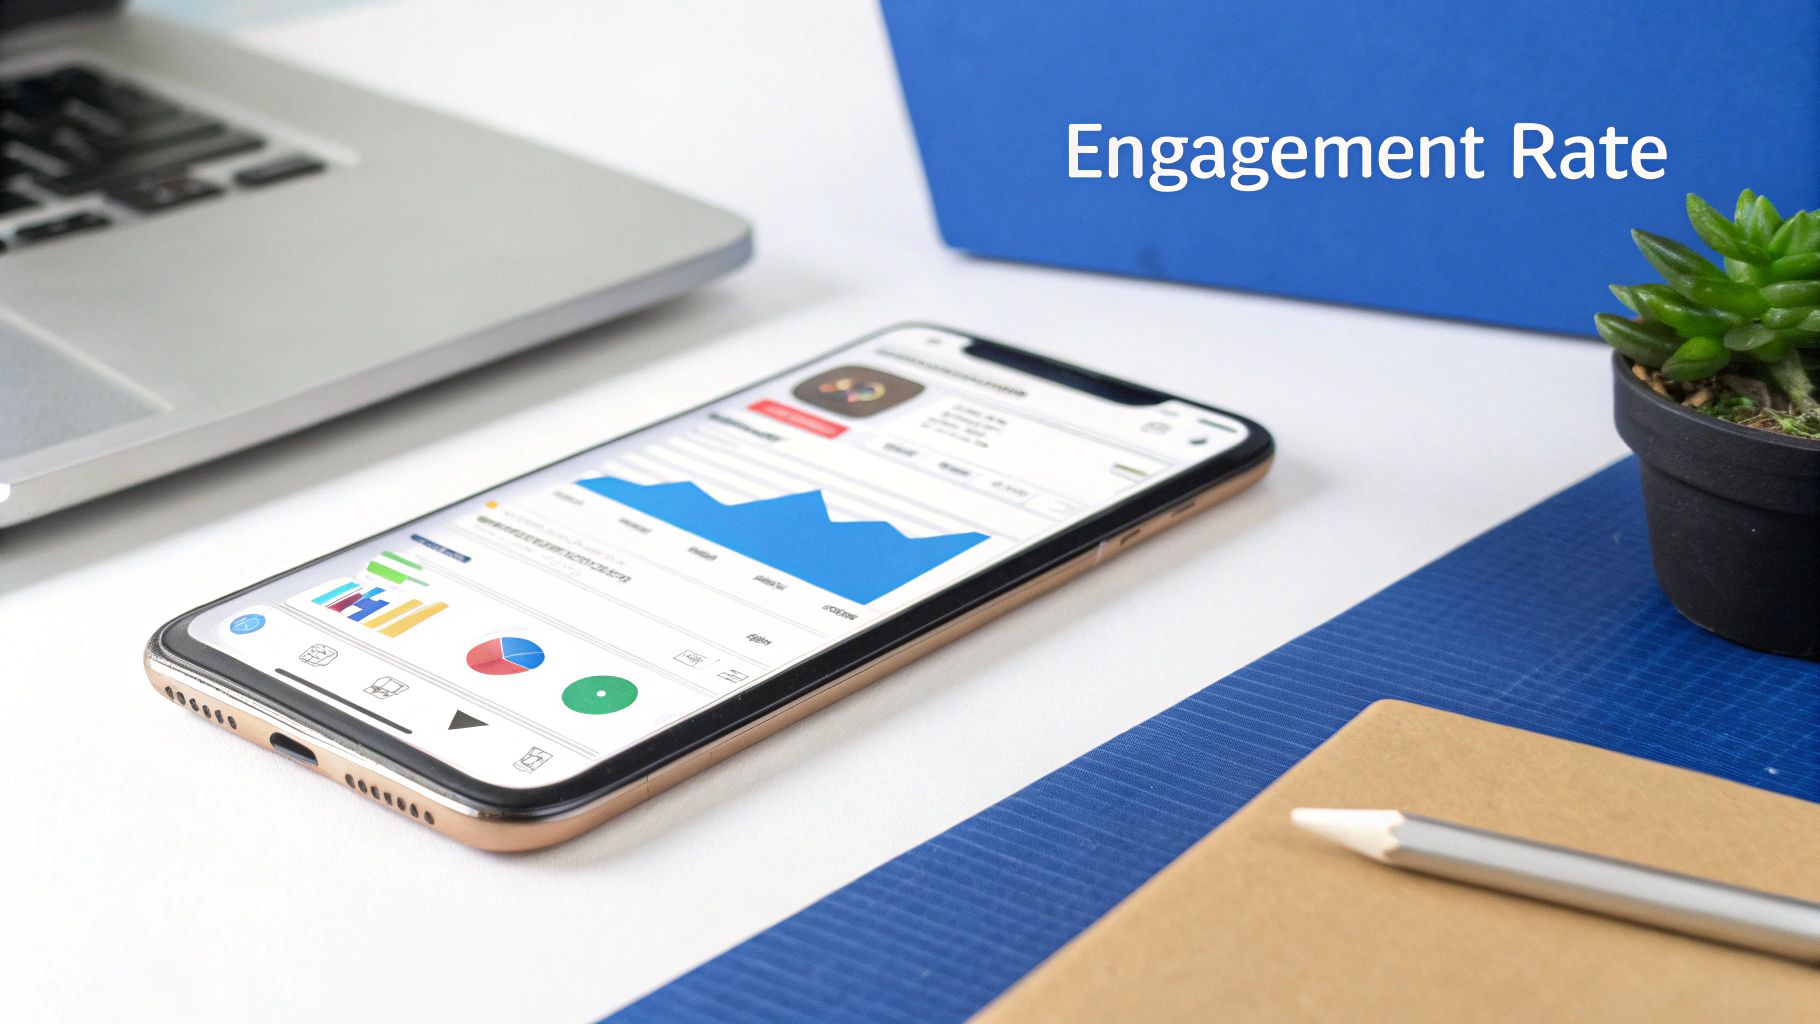
How to Calculate Your Engagement Rate
Your Engagement Rate is the gold standard for measuring interaction. The thing is, there isn't just one way to figure it out. The two most common formulas—one based on followers, the other on reach—each give you a different strategic angle.
1. Engagement Rate by FollowersThis is the classic formula. It tells you what percentage of your existing follower base is actively interacting with your stuff. It’s a solid way to check the pulse of your core community’s loyalty and interest.
- The Formula: (Total Likes + Comments + Saves + Shares on a Post / Total Followers) x 100
This method is simple, but it can be a bit misleading. If a post goes viral and reaches a ton of non-followers, this formula won't capture its true impact because the denominator (your follower count) doesn't change.
2. Engagement Rate by ReachMany experts consider this a more accurate measure of a post's performance. Why? Because it measures engagement against the actual number of people who saw it.
- The Formula: (Total Likes + Comments + Saves + Shares on a Post / Total Reach of that Post) x 100
This calculation shows you how engaging your content was to everyone who saw it, including both followers and non-followers. A high engagement rate by reach is a powerful sign that your content is hitting the mark. For a more detailed walkthrough, check out our guide that helps you calculate your Instagram engagement rate like a pro.
Try It Yourself:Don’t just read about engagement—measure it. Use our free Instagram Engagement Rate Calculator to instantly see how your posts perform. Just enter your likes, comments, saves, and reach to get your real engagement percentage in seconds. It’s the fastest way to understand what’s working and where to improve before your next post.
Proven Tactics to Boost Engagement
Knowing your numbers is only half the job. The real work is in making them better. Driving meaningful interaction isn’t about luck; it’s about having a deliberate content strategy.
- Ask Strategic Questions: Don't just post and run. Start a conversation! Ask open-ended questions in your captions that invite real responses, not just simple "yes" or "no" answers.
- Create Save-Worthy Content: Put yourself in your audience's shoes. What information would they want to keep? Think checklists, how-to guides, infographics, or killer resource lists. These are prime candidates for saves.
- Run Polls and Quizzes in Stories: Interactive stickers are your best friend. They offer a super easy, low-friction way for your audience to engage. They're quick, fun, and give you instant feedback.
The need for dynamic content is not up for debate. Instagram is the world's third most popular social network and the fourth most visited website globally, so user expectations are high. Data shows that the Reels feature alone pulls in an average video view rate of 10.53%, which points to massive user interaction with short-form video. This confirms Instagram's role as a digital hub where people spend serious time. You can dig into more of Instagram’s impressive statistics on Metricool.com. When you embrace formats that encourage people to participate, you're aligning your strategy perfectly with both user behavior and the platform's strengths.
Connecting Instagram Activity to Business Results
It’s easy to get a warm, fuzzy feeling from a flood of likes and comments. But let's be real—those numbers don't pay the bills. The real challenge, and where the pros separate themselves from the amateurs, is translating that social buzz into tangible business impact.
To prove your Instagram strategy is more than just a feel-good exercise, you have to connect your activity to revenue and growth. You need to focus on the Instagram performance metrics that show you're moving the needle.
Think of your Instagram profile as a bridge. On one side, you have your buzzing, engaged community. On the other, you have your business—your website, your products, your booking calendar. The metrics that truly matter are the ones that measure how many people are actually crossing that bridge.
When someone takes that step, it signals clear intent. It’s the strongest sign that your content isn't just entertaining them, but actually persuading them to act.
Key Metrics That Drive Business Outcomes
While you can track dozens of data points, only a few directly signal that a follower is on the path to becoming a customer. These are the numbers you should obsess over when calculating your return on investment.
- Website Taps: This is the big one. It's the most direct measure of how well your profile funnels traffic to your digital storefront. Every click on your bio link is a potential lead, sale, or subscriber. It’s your primary gateway.
- Profile Visits: A spike in profile visits is often a leading indicator. It means your content—be it a Reel, Story, or post—was compelling enough to make someone stop scrolling, leave the feed, and actively seek out more information about your brand.
- Product Tag Clicks: For any e-commerce brand using Instagram Shopping, this metric is pure gold. It tells you exactly how many people saw a product in a post or Story and clicked to learn more, showing undeniable purchase intent.
Tracking these numbers shifts the entire conversation. You'll go from asking, "Are people liking our posts?" to "Is our Instagram generating qualified leads and sales?" It's a game-changing perspective.
The ultimate goal here is to confidently prove the ROI of your Instagram marketing. When you track these conversion-focused metrics, you transform your social media from a cost center into a legitimate, revenue-generating engine.
This is how you justify your marketing budget, secure more resources, and make strategic decisions backed by cold, hard data.
Setting Up Your Tracking for Accurate Measurement
To get a crystal-clear picture of how Instagram is fueling your business, you need a reliable way to track the entire customer journey. This means combining Instagram's built-in analytics with more robust methods.
One of the most powerful tools in your arsenal is the UTM parameter. These are simple bits of code you add to the end of a URL. They don't change where the link goes, but they tell your analytics tools (like Google Analytics) exactly where that visitor came from. You can create unique UTM links for specific campaigns, your main bio link, or even individual Story slides.
This lets you see not just that someone came from Instagram, but what they did after they landed on your site. Did they buy something? Sign up for your newsletter? This is the granular data you need to calculate true ROI.
Here’s what this looks like in the real world:
- Scenario: A consultant wants to know how many discovery calls are booked directly from their Instagram profile.
- Action: They create a unique UTM link for their Calendly or booking page and place it in their Instagram bio.
- Result: Inside Google Analytics, they can filter traffic from that specific UTM source and see exactly how many people completed the "Book a Call" conversion goal.
This kind of tracking provides undeniable proof of impact. For those who want to blend their Instagram presence even more seamlessly into their website, exploring detailed guides for Instagram feed integration can offer a path to creating a more cohesive user experience. It's all about making it as easy as possible for your audience to take that next step with you.
{{INTERN}}
Making Sense of Your Story and Reel Analytics
Stories and Reels aren't just separate features on Instagram; they're entirely different worlds. They have their own rules, their own audiences, and most importantly, their own specific analytics. While your general engagement numbers give you a decent bird's-eye view, the data from these fast-paced, vertical formats tells you what's really happening with your content.
Think of it this way: a feed post is like a sit-down dinner. You measure success by thoughtful bites, like comments and saves. Stories and Reels, on the other hand, are a high-speed tasting menu. The feedback is instant, showing you exactly which "tastes" made people stop and savor, which they skipped, and which they went back for a second helping of.
Reading Between the Lines of Instagram Story Metrics
Instagram Stories are all about sequence and timing—they disappear after 24 hours, after all. Because of this, their metrics are laser-focused on how people move through your content and how long you can hold their attention. It’s about much more than just views; this data shows you the moment-to-moment impact of your storytelling.
Here are the key metrics you need to be watching:
- Taps Forward and Taps Back: "Taps Forward" tells you how many people skipped to your next Story slide. A few taps forward are normal, but a huge number is a clear sign that a particular slide just didn't land. "Taps Back," however, is gold. It means someone found your content so good, so interesting, or so funny that they literally went back to see it again.
- Replies: A reply is the Story equivalent of a comment, but it's even more personal because it opens a private conversation. When someone takes the time to reply, it means your content hit a nerve and sparked a genuine connection.
- Exit Rate: This one is a big deal. The Exit Rate shows you the percentage of people who swiped away from your Stories altogether after seeing a specific slide. A high exit rate on a slide is a major red flag, telling you that piece of content caused your audience to lose interest and leave.
By keeping an eye on which slides get lots of taps back and which ones cause a mass exodus, you'll quickly learn what your audience actually wants to see.
The Anatomy of a Winning Reel
Reels are Instagram’s main discovery tool. They're built to rocket your content out to people who don't even follow you yet. Because of that, their success is all about grabbing attention immediately and keeping it. The most crucial metrics here revolve around how long people watch and how often they share.
A view is just the start. The real currency for the Instagram algorithm is watch time. A Reel that gets watched all the way through—or even better, on a loop—has a much, much higher chance of getting pushed out to new audiences than one that gets swiped away after just a few seconds.
Here’s what to focus on for Reels:
- Views (or Plays): This is the total number of times your Reel started playing. It’s a good top-level number for measuring awareness, but it doesn't tell the whole story without the other metrics.
- Average Watch Time: This is arguably the most important Reel metric of them all. It shows the average amount of time people spent watching your video. A high average watch time is a massive signal to Instagram that your content is high-quality, which makes the algorithm want to show it to more people.
- Saves: Just like with feed posts, a save on a Reel means someone found your content so valuable or entertaining that they want to be able to find it again later. This is a huge vote of confidence and a strong sign you've created something truly useful.
Putting It All Into Practice
Okay, so you have the data. Now what? The goal isn't just to look at the numbers; it's to let them guide your creative strategy.
For Stories, your main enemy is the exit. Fight back by making your Stories interactive. Use polls, quizzes, question boxes, and sliders to give people something to do instead of just swiping away. If you see a slide with a terrible exit rate, take a hard look at it. Was it too salesy? Was the text a mess to read? Was the image just plain boring?
For Reels, it all comes down to the first three seconds. You need a powerful hook to stop the scroll. Tapping into trending audio can also give you a massive boost in discovery. Look at your best-performing Reels—the ones with a high average watch time—and figure out what they have in common. Was it a specific editing trick? A type of tutorial? A certain storytelling style? Find what works and do more of it.
How to Build a Simple Instagram Reporting Dashboard

All this data is great, but it's pretty much useless until you can see the story it’s telling. That's where a reporting dashboard comes in. It transforms those raw numbers into a clear picture, helping you spot trends and make much smarter decisions.
Forget about building something overly complex. A simple, focused dashboard is always more effective than a cluttered one that tries to track everything at once.
Your first move is to pick the Key Performance Indicators (KPIs) that actually line up with your business goals. A dashboard isn't just a data dump—it’s a curated look at what truly matters for your brand.
Think of your dashboard like the cockpit of an airplane. The pilot doesn't need to see every single mechanical detail. They just need the critical dials—altitude, speed, fuel—to know they're on course to their destination.
The Instagram performance metrics you choose should be a direct reflection of your main objective. This is how you make sure you’re tracking real progress, not just random activity.
Aligning Metrics with Your Goals
The metrics you prioritize will shift based on what you’re trying to accomplish. There's no such thing as a one-size-fits-all dashboard here.
- For Brand Awareness: Your focus should be on top-of-funnel metrics. We're talking Reach, Impressions, and Follower Growth Rate. These numbers show you how well you're expanding your visibility and getting in front of new people.
- For Audience Engagement: Here, you'll want to track things like Engagement Rate by Reach, Saves, and Comments. These KPIs tell you if your content is genuinely connecting with the people who see it.
- For Conversions & Sales: This is where the rubber meets the road. Prioritize bottom-of-funnel data like Website Taps, Product Tag Clicks, and any traffic you're tracking with UTM parameters. This is how you measure the direct impact on your business.
Structure your report to tell a story. Start with a high-level summary of your main KPIs for the reporting period (week, month, etc.). Then, follow up with a breakdown of your top-performing content. Pinpoint any posts, Reels, or Stories that crushed your average benchmarks.
Finally, wrap it up with a brief "Insights & Actions" section. This is where you jot down key takeaways and outline what you plan to do differently next month based on what the data told you. This simple framework gets you out of the cycle of just collecting numbers and into a rhythm of making data-informed decisions that constantly improve your strategy.
Got Questions About Instagram Metrics? We've Got Answers.
Diving into Instagram data can feel like you're trying to read a foreign language. But once you get the hang of it, you'll see it’s not so scary. A few questions pop up constantly, so let's clear the air and get you the straightforward answers you need to start making smarter moves for your brand.
What’s a Good Engagement Rate on Instagram, Really?
Ah, the million-dollar question. The honest-to-goodness answer? It's not a simple number. A "good" engagement rate is a moving target, and it changes based on your industry, your specific niche, and most importantly, how many followers you have.
Smaller accounts almost always have higher engagement rates. It's just easier to connect with a tighter-knit community. For instance, an account with less than 5,000 followers might rock a 4.5-5.0% rate. But a huge brand with over 100,000 followers? They're often happy with something closer to 1-2%. So, stop comparing your small business to a global giant. The real competition is yourself.
Forget industry averages for a second. The most powerful benchmark is your own progress. Are you doing better this month than last month? That's the true signal of a healthy, growing account.
What's the Difference Between Reach and Impressions?
This one trips people up all the time, but a quick analogy will make it stick in your head for good.
- Impressions are the total number of times your content was shown to someone. If a single person sees your post three separate times, that's 3 impressions.
- Reach is the number of unique people who saw your content. That same person who saw your post three times? They only count as 1 for reach.
Think of it like this: impressions are the total tickets sold for a movie, while reach is the number of individual people in the theater. Both tell a story, but reach gives you a much better sense of how many new people your message is actually spreading to.
{{INTERN}}
How Often Should I Check My Instagram Analytics?
This is a delicate balance. You want to be informed, but you don't want to get sucked into a data-analysis black hole. Checking your numbers too often is a recipe for making knee-jerk decisions based on the natural daily fluctuations of the platform.
For most businesses, a two-tiered approach works best:
- The Weekly Check-in: Set aside 15 minutes once a week. Use this time to quickly spot your best-performing posts, keep an eye on overall engagement trends, and see if anything totally flopped. It keeps you nimble without getting obsessive.
- The Monthly Deep Dive: This is where you zoom out. Carve out a bit more time to look at the bigger picture—follower growth, website clicks, and how you’re tracking against your main goals. This is when you spot the major patterns that should inform your strategy for the next month.
This rhythm helps you make choices based on solid data, not daily panic, and saves you from a serious case of analysis paralysis.
Ready to stop guessing and start growing? BoostFluence provides the tools and services you need to turn your analytics into actionable growth strategies. From boosting visibility to managing your content, we make it simple to expand your influence and achieve your goals. Grow smarter on Instagram with BoostFluence.
Want to Grow Your Instagram?
Use BoostFluence tools to grow your followers, engagement, and authority — for ambitious agencies, businesses and creators.


Get More Instagram Followers
Reach your target audience and grow your followers with interactive campaigns.

Swipe Up to Get More Followers!
Get More Instagram Followers
Reach your target audience and grow your followers with interactive campaigns.